
A baghouse and a wet scrubber each report a removal efficiency, and those two figures are rarely measured on the same basis. One is a dry mass-capture value taken across a fabric filter; the other is measured inside a liquid loop, where droplet contact, mist-eliminator carryover, and sample conditioning all shape the result before anything is weighed. Reading the two numbers as interchangeable is the mistake that sends dust-control projects down the wrong route. This baghouse vs wet scrubber efficiency comparison replaces that shortcut with a selection basis: six variables that decide the route, the design input each option demands, the water and waste ledger that decides whether wet collection is feasible at all, a worked example, and an acceptance checklist.
Key Takeaways
- A baghouse is a dry fabric-filter collector; a wet scrubber is a gas–liquid contactor. — That difference, not the efficiency percentage, decides the baghouse vs wet scrubber efficiency comparison for your duty.
- Three gates eliminate a route before efficiency matters. — Sticky or hygroscopic dust, temperature above the fabric ceiling, and combustible dust each remove one option outright.
- Air-to-cloth ratio is the baghouse design input. — The published table runs about 1.5–3.5 ft/min for shaker/woven and 5–14 ft/min for pulse-jet/felt, by dust type.
- Water and sludge decide whether wet is feasible. — Makeup and blowdown must balance, and metal-bearing sludge may need hazardous-waste testing before it can leave the site.
- Some duties belong to the baghouse. — This page says so explicitly: the constraint is your dust, not the equipment we build.
Baghouse vs Wet Scrubber Efficiency Comparison: The Decision Order
Route selection follows a fixed order, and efficiency sits late in that order. The baghouse vs wet scrubber efficiency comparison becomes tractable only after the dust and the gas have been tested against three elimination gates, because a route that fails a gate cannot be rescued by a stronger removal figure. Work the sequence from the top and the choice often collapses to a single viable option before any capital cost enters the discussion.
Why the Two Efficiency Figures Cannot Be Compared Directly
A removal efficiency is a ratio of mass captured to mass entering, and the two routes define both terms under different conditions. A baghouse reports a dry-basis figure, because the captured material leaves as solid dust cake on the fabric and is weighed as dry mass. A wet scrubber reports a figure produced inside a liquid loop, where part of the captured material stays dissolved or suspended in the recirculating water, part drains back into the vessel from the mist eliminator, and the outlet sample must be conditioned before it can be weighed.
Two consequences follow when a buyer reads those figures side by side. A wet scrubber can post a high capture value while re-entraining collected droplets past the mist eliminator, so the number describes the sampling plane, not the stack. Entrained droplets also carry dissolved solids that a dry-basis test never records, and that is why a wet-basis figure measured at one droplet loading says little about performance at another.
Matching the measurement basis is the practical fix. Ask which basis a quoted figure was measured on, at what particle-size cut, and where in the duct the sample was drawn, then compare only figures that share all three conditions.
Choose a Baghouse When the Dust and Gas Stay Dry and Within Limits
A baghouse is the stronger route when the dust is dry, free-flowing, and recoverable as a solid product. Fabric filtration builds a dust cake on the cloth surface, and that cake performs most of the fine-particle capture, which is why the highest removal rates on this route appear on submicron material. The route also keeps collected dust in a dry, reusable form and needs no water supply, no blowdown stream, and no sludge handling.
Three conditions bound the choice. The gas must stay above its acid dew point so the cloth never runs wet, the temperature must stay inside the ceiling of the selected fabric, and the dust must be non-sticky and non-hygroscopic so the cake releases cleanly during cleaning. Dust with recovery value strengthens the case, because a hopper product can return to the process while a scrubbed solid leaves as sludge.
Where the dew-point margin cannot be guaranteed, the baghouse case weakens regardless of how good its efficiency looks. Batch processes that start cold and gas streams carrying a condensing acid component both fall into that group.
Choose a Wet Scrubber When the Dust or the Gas Forces Water
A wet scrubber is a gas–liquid contactor, not a filter, and its advantage is condition tolerance instead of peak fine-particle capture. The route accepts dust that would blind fabric: sticky, hygroscopic, oily, or condensable material that forms a permanent deposit instead of a cake that releases. A wet scrubber also takes gas temperatures far above any fabric ceiling, which removes the need for dilution air or a pre-cooler in many hot duties.
Wet contact buys three capabilities at once. The same contact quenches and saturates the gas stream, absorbs part of a soluble gas load in the same vessel, and holds combustible dust in a water slurry, which changes the explosion-protection problem instead of removing it. Each capability carries a cost: a water supply, a blowdown stream, and a sludge that has to be characterized before it leaves the site.
Decision point: after this module you can decide whether your own duty is baghouse-only, wet-only, viable on both routes, or blocked on both, and you can see that the classification turns on dust and gas conditions, not on an advertised efficiency percentage.
What Each Efficiency Number Measures
Two collectors can each quote the same headline efficiency and still perform differently on the dust your process emits. The baghouse vs wet scrubber efficiency comparison turns on which quantity each figure represents, on the basis it was measured against, and on the particle size at which it was evaluated, not on the headline itself. Every figure in this module carries the condition that makes it valid, because a percentage stripped of its basis cannot support a selection decision.
Total Removal Rate and Grade Efficiency Describe Different Things
A total removal rate is the mass of particulate captured divided by the mass entering, with no regard for particle size. Grade efficiency is the same ratio computed inside a narrow size band, so one collector has a single total figure and a whole curve of grade figures. Equipment guarantees and site permit limits usually target one size band, not the whole distribution, which is why a total number alone rarely settles a comparison.
Two collectors that each report the same headline percentage become incomparable the moment their inlet particle-size distributions differ. A device that removes most of the coarse fraction can post a high total figure while passing the fine fraction that carries the health and opacity risk, and a device tuned for fine particles can post an identical total figure with far better fine-particle performance. Grade values resolve that ambiguity; a total figure hides it.
Fabric filters hold efficiencies generally in excess of 99 or 99.9 percent for particles from submicron sizes up to several hundred microns, as reported in the EPA cost-manual baghouse chapter, §6 Ch.1. Grade values cited alongside run about 99.8 percent at 10 µm, with a 99.6 to 99.9 percent band for fine particles, and they are literature values, not agency measurements. Treat them as evidence that the fine band is well covered, and keep the word generally attached whenever the figures travel.
What Each Route’s Efficiency Figure Is Based On
A baghouse figure is a dry-mass figure: the collected material sits as dust cake on the fabric, and that cake, not the cloth weave, performs most of the fine-particle capture. A wet figure is produced inside a liquid loop, where captured material splits between the slurry and the drained liquid, and mist-eliminator carryover returns a share of it to the vessel. The outlet sample on a wet system also has to be conditioned before it can be weighed, which adds a step with no counterpart on the dry side.
The two figures are therefore not directly comparable unless the measurement basis, the size cut, and the sampling plane all match. Ask for those three properties before accepting any efficiency figure in a quotation, and treat a number offered without them as a marketing statement, not a design input.
The table carries the figure, its unit, the condition attached to it, and its attribution for the baghouse vs wet scrubber efficiency comparison, so any number you are offered can be checked before it is used.
| Figure as usually quoted | What it measures | Basis | Condition attached | Attribution |
|---|---|---|---|---|
| Fabric filtration: generally above 99 or 99.9 percent removal | Total removal rate, all sizes combined | Dry mass captured as dust cake on fabric | Inlet particles from submicron sizes to several hundred microns | §6 Ch.1 |
| Fabric filtration: about 99.8 percent at 10 µm; 99.6 to 99.9 percent for fine particles | Grade efficiency inside a named size band | Literature values cited in the manual, not agency measurements | Holds only for the size band named | §6 Ch.1 |
| Wet collection: PM10 controlled at generally under 20 in. w.c. pressure drop | Pressure drop required to reach a PM10 target | Gas–liquid contactor; captured material splits between slurry and drained liquid | Controlled fraction is PM10 | §6 Ch.2 |
| Wet collection: PM2.5 generally needs 25 in. w.c. or more | Pressure drop required to reach a PM2.5 target | Same contactor basis | Controlled fraction is PM2.5 | §6 Ch.2 |
| Wet collection: pressure drop above about 45 in. w.c. adds little removal | Marginal return on added pressure drop | Same contactor basis | General statement, not a cutoff for every design | §6 Ch.2 |
| High-energy wet configuration: 97 to 99.9 percent overall removal | Total removal rate for one configuration | Manual example configuration | Not transferable to wet scrubbers in general | §6 Ch.2 |
§6 Ch.1 covers baghouse filtration; §6 Ch.2 covers wet scrubbers for particulate matter. Both sets of values are reference figures for design screening, not permit limits.
Where Wet Collection Has to Buy Its Fine-Particle Performance
Removing fine particles in a wet scrubber is a pressure-drop purchase, and the price rises faster than the benefit. PM10 control is generally achieved at under 20 in. w.c. of pressure drop, and PM2.5 control generally needs 25 in. w.c. or more, per §6 Ch.2 of the cost manual, which is a step up in fan energy and not a small trim. Push further and the return flattens: above about 45 in. w.c., added pressure drop does not significantly increase removal.
That marginal curve changes how a wet performance claim should be read. A quoted total efficiency in the 97 to 99.9 percent range for a high-energy configuration describes one example in the manual, and the figure reflects the pressure drop that configuration was built to sustain. Budget the fan power for the size band you must control, and confirm a quoted number was produced at a comparable pressure drop before you compare it with a rival’s figure.
The wet route therefore reaches a fine-particle target only inside its highest fan-energy band. Fabric filtration holds its removal rates with a typical system pressure drop of 5 to 20 in. w.c., so on a PM2.5 duty the energy step belongs to the wet option unless another constraint forces water.
Decision point: you can now tell whether a quoted efficiency figure supports your duty by checking its basis, its size cut, and its sampling plane, and you can read wet fine-particle performance as a pressure-drop commitment whose return flattens above a known point.
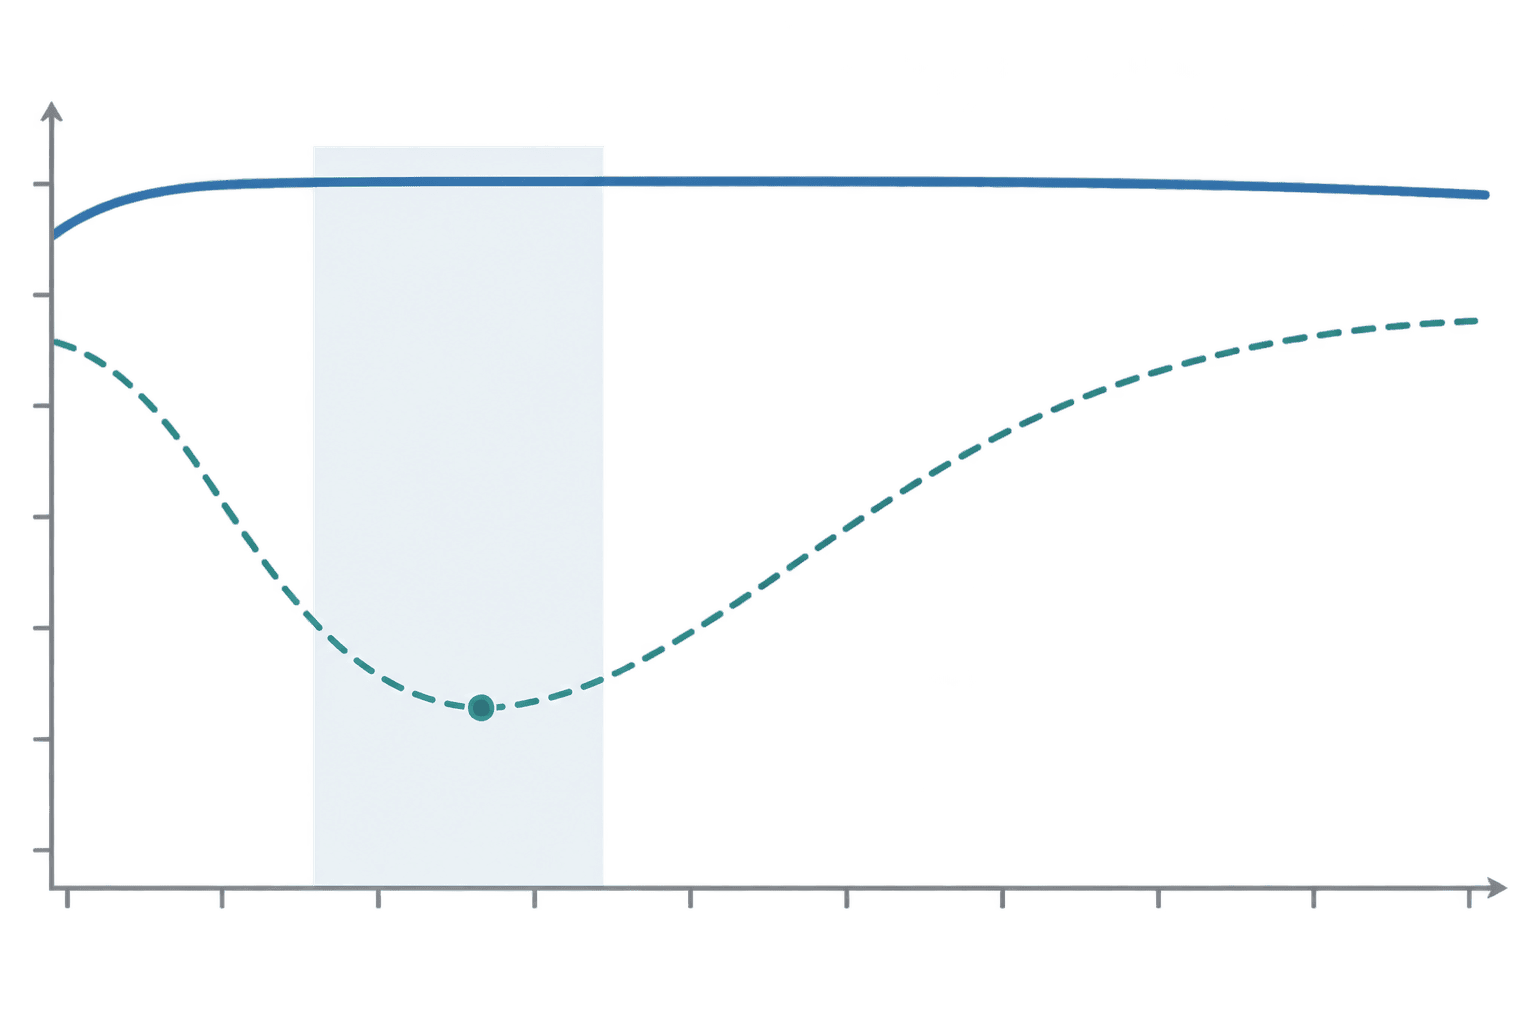
Where the Baghouse vs Wet Scrubber Efficiency Comparison Is Decided
Two of the three gates that remove a route before efficiency is discussed act on the baghouse, and both are settled by the dust and the gas, not by equipment choice. The baghouse vs wet scrubber efficiency comparison only becomes a real comparison for duties that survive dust adhesion, the temperature window, and combustible-dust requirements, and a duty that fails a gate has no baghouse option to weigh. Work both gates in this module before you size anything.
Sticky, Hygroscopic and Oily Dust Blinds Fabric
A baghouse depends on the dust cake releasing from the cloth during each cleaning cycle, and adhesive dust defeats that mechanism. Sticky, hygroscopic, or oily particles bond to the fibers and to each other, so the cake stops falling away and the deposit thickens with every cycle. Condensable material causes the same damage from the gas side, landing as a tacky film whenever the cloth drops below its condensation point.
The operating penalty shows up as pressure drop first and as bag life second. A blinded fabric forces the fan to work against a rising resistance, cleaning cycles run more often and at higher intensity, and the mechanical action of aggressive cleaning eventually tears bags that were never the problem. Replacement intervals shorten while the fabric itself remains sound.
This is the first elimination gate, and it removes the baghouse option outright. Test the dust for adhesion and hygroscopy, and test the gas for condensable components, before you price either route; if the deposit does not release, no fabric selection fixes it.
Fabric Temperature Ceilings Set the Upper Limit
Every filter medium has a temperature above which it degrades, and that ceiling sets the upper limit of the second gate. The listed limits for common media span 180 °F for cotton to 500 °F for Fiberglas, with Nextel listed at 1,400 °F, and they come from the EPA cost-manual baghouse chapter (Table 1.6). Gas temperatures up to about 500 °F, with short surges to about 550 °F, are accommodated routinely in some configurations, which is why high-temperature duties tend to specify glass-fiber media.
| Filter medium | Temperature limit |
|---|---|
| Cotton | 180 °F |
| Nylon | 200 °F |
| Creslan | 250 °F |
| Orlon | 260 °F |
| Filtrone | 270 °F |
| Dacron | 275 °F |
| Nomex | 375 °F |
| Fiberglas | 500 °F |
| Nextel | 1,400 °F |
Limits from §6 Ch.1, Table 1.6 of the cost manual, as given for that edition.
Those limits describe one edition of the manual, and current media data sheets govern a real selection. Suppliers introduce blends, surface treatments, and scrim constructions that move a ceiling in either direction, so treat the table as a screening band and confirm the actual medium with the fabric maker before you fix the gas-side design temperature. Above the ceiling of the chosen medium, the gas has to be cooled before it reaches the fabric, which adds energy cost and, where the gas is also wet, a quench step.
Dew Point and the Condensation Window
A baghouse has to run above the acid dew point of its gas stream, because liquid acid on the cloth destroys the cake and corrodes the housing. Moisture and sulfur or halogen compounds set that dew point, and the margin between it and the operating temperature is what keeps the fabric dry. A small margin is workable; a margin that disappears for hours at a time is not.
Cold starts are the usual failure point, because a housing and its gas reach operating temperature at different rates. Batch processes, outdoor duct runs, and gas streams carrying a condensing acid component all open windows in which the cloth sits below the dew point. Insulation, preheating, and startup sequencing manage the window; none of them removes it.
Together with the fabric ceiling, the condensation window closes the second elimination gate. Where the dew-point margin cannot be guaranteed through every operating mode, the baghouse case weakens no matter how good its efficiency looks, and the wet option gains ground because a wet scrubber saturates the gas instead of trying to stay dry.
Decision point: you can now eliminate the baghouse from any duty where the dust blinds fabric, the gas exceeds the medium’s ceiling, or the dew-point margin cannot be held, and all three tests are settled before efficiency enters the comparison.
Combustible and Reactive Dust: What Changes for Each Route
Combustible dust is the third gate, and it behaves differently from the first two: it does not eliminate either route, it imposes obligations on both. A duty with explosible dust needs a hazard assessment and a protection concept whichever collector is selected, so the choice between a baghouse and a wet scrubber moves the protection problem instead of removing it. This module sets out what both routes must satisfy, what water changes, and where the evidence behind this page stops.
What Both Routes Must Satisfy
A dust hazard assessment and a protection design are required on either route, so no collector choice removes the obligation. Metal dusts including aluminium, magnesium, titanium and zinc can explode in dust form, and a facility handling them has to treat the material as explosible until a test programme shows otherwise. The obligated framework comes from OSHA: 29 CFR 1910.94 for ventilation, 1910.307 for hazardous classified locations, and 1910.1200 for hazard communication.
Where no specific standard applies to a given process, the general-duty clause 5(a)(1) carries the requirement instead. Those provisions set the framework, not the design, and the project’s authority having jurisdiction, its insurer, and the applicable fire code govern the protection concept that finally gets built.
Treat the assessment as a fixed cost of the duty, not as a consequence of the route you pick. Whoever supplies the collector still has to be told the dust’s explosibility data and the protection concept selected, because neither route can be designed around missing material data.
What Water Changes and What It Introduces
Water changes the explosion-protection problem instead of deleting it. In a wet collector, captured dust is wetted or submerged, so the interior is no longer a dry dust-cloud volume that can be ignited as one. What remains is a design question: the vessel, the ductwork upstream, and the collected sludge all still hold explosible material.
Reactive metals add a complication that a dry route does not carry. Aluminium and magnesium react with water, and the practical consequence of wetting them in a recirculating system is that hydrogen can be generated in the vessel, which is commonly addressed by ventilation of the headspace, by monitoring, and by limiting the reactive fraction that reaches the scrubber. Those measures follow from the chemistry, not from a measured release rate on your duty, so treat them as engineering judgement and not as a tested value.
The wetted solids leave the scrubber as sludge, not as a dry hopper product. Sludge carries its own question, whether it must be managed as hazardous waste, and that assessment belongs to the water and waste ledger, where the characterization path is set out.
The Evidence Boundary on This Module
This page does not rank the two routes on combustible-dust safety. The consensus standards that would support such a ranking were not obtained for this article, so any ordering of baghouse versus wet scrubber on explosion risk would be an assertion without a citable basis. What this page can state is the framework requirement above.
Both routes remain usable on a combustible-dust duty when the protection concept is designed for it and accepted by the authority having jurisdiction. Nothing in this module says a wet collector is safer than a dry one, and nothing says the reverse; the difference is the form the protection takes, and the engineering work behind it.
Decision point: you can now name what a combustible-dust duty requires on either route, you can tell which protection questions water changes and which it leaves in place, and you know that this page declines to rank the routes on explosive risk.
Design Input for a Baghouse: Air-to-Cloth Ratio
A baghouse has one design input that outranks the rest, and it is a number you can specify before you ask for a price. Air-to-cloth ratio sets the cloth area, and the cloth area sets the housing footprint, the cleaning system, and the pressure drop the fan must carry. Read the ratio from the application table, then adjust it for your dust and your grain loading.
What Air-to-Cloth Ratio Is
Air-to-cloth ratio is the gas volume passing through each unit of cloth area, expressed in ft³/min per ft² of net cloth area, which reduces to a filtration velocity in ft/min. It is the most important design parameter for a fabric filter, and the pressure drop across the bags is the operating parameter that follows from it. Doubling the ratio halves the cloth area needed for the same gas volume, and the two values are inversely related by definition.
Net cloth area is the fabric filtering at any given moment, and gross cloth area is larger because compartments come off-line for cleaning while the rest carry the full gas flow. Scale-up factors in the EPA cost-manual baghouse chapter convert net area to gross area, starting at a multiplier of about 2 for the smallest filters, so a ratio quoted on net area understates the steel a supplier has to build. Confirm which area a quoted ratio refers to before comparing two offers.
Values by Dust Type
The ratio is not derived from first principles; it is read from the application values tabulated by dust type and then adjusted for particle size and dust load. The ratio table gives two columns, one for shaker or woven fabric and one for pulse-jet or felt fabric, and the spread between them is wide enough that the cleaning method matters as much as the dust.
| Dust or material | Shaker or woven fabric (ft/min) | Pulse-jet or felt fabric (ft/min) |
|---|---|---|
| Alumina | 2.5 | 8 |
| Asbestos | 3.0 | 10 |
| Bauxite | 2.5 | 8 |
| Carbon Black | 1.5 | 5 |
| Cement | 2.0 | 8 |
| Clay | 2.5 | 9 |
| Coal | 2.5 | 8 |
| Cosmetics | 1.5 | 10 |
| Enamel Frit | 2.5 | 9 |
| Feeds and Grain | 3.5 | 14 |
| Fertilizer | 3.0 | 8 |
| Flour | 3.0 | 12 |
| Fly Ash | 2.5 | 5 |
| Graphite | 2.0 | 5 |
| Gypsum | 2.0 | 10 |
| Iron Ore | 3.0 | 11 |
| Iron Oxide | 2.5 | 7 |
| Lead Oxide | 2.0 | 6 |
| Lime | 2.5 | 10 |
| Limestone | 2.7 | 8 |
| Paint Pigments | 2.5 | 7 |
| Plastics | 2.5 | 7 |
| Quartz | 2.8 | 9 |
| Sand | 2.5 | 10 |
| Sawdust (Wood) | 3.5 | 12 |
| Silica | 2.5 | 7 |
| Soap and Detergents | 2.0 | 5 |
| Starch | 3.0 | 8 |
| Sugar | 2.0 | 13 |
| Talc | 2.5 | 5 |
§6 Ch.1, Table 1.1. Values are ft/min on net cloth area, and the rows above are a selected subset.
Three conditions travel with these values. They apply to net cloth area, the annotation calls them generally safe design values whose application still requires consideration of particle size and grain loading, and the rows shown are a selected subset of the roughly 40 materials covered, not the whole table.
Across the materials covered, the overview range runs about 1.5 to 3.5 ft/min for shaker or woven fabric and 5 to 14 ft/min for pulse-jet or felt fabric. A specific duty can sit outside that band once particle size and dust load are considered, which is why the tabulated rows matter more than the summary.
What Too High or Too Low Costs You
A ratio estimated too high forces more gas through each square foot of cloth, which raises the pressure drop and increases particle penetration, so removal efficiency falls. The effect compounds because the higher dust arrival rate per unit of cloth demands more frequent cleaning, and each cleaning cycle disturbs the cake that is doing the filtering.
A ratio estimated too low builds a larger baghouse than the duty needs. The cloth area required rises in proportion, and with it the housing steel, the number of bags, the cleaning system, and the floor space the unit occupies, so capital cost climbs above what the application justifies.
Neither direction can be resolved from first principles, so the practical route is to start from the tabulated value for the closest matching dust and adjust for finer particles and heavier loading. A screening ratio produced that way is a design basis, not a performance guarantee, and a supplier’s efficiency guarantee has to be tied to a stated ratio and a stated cleaning mode to mean anything.
Decision point: you can now state a screening air-to-cloth ratio for your dust from the application table, you can ask a supplier which cloth area a quoted ratio refers to, and you know that any efficiency guarantee has to name the ratio and the cleaning mode it was written against.
Design Input for a Wet Scrubber: L/G, Pressure Drop and Mist
A wet scrubber is specified by three numbers before its vendor is chosen: liquid flow per unit of gas, the gas-side pressure drop, and the mist eliminator allowance. Each of those numbers converts directly into operating cost, pump power, fan power, and wash water, so they are inputs to specify, not features to accept. Set them against the size band your limit targets, and the wet route’s operating envelope becomes visible before you commit.
L/G: Where More Liquid Stops Helping
L/G is the liquid-to-gas ratio, the scrubbing liquid flow supplied per unit of gas volume, and the design figures for this route are stated in gallons per 1,000 ft³ of gas. Liquid flow drives the number of droplet-to-particle contacts inside the vessel, so raising it improves capture up to a point. Beyond that point the contact opportunity is already saturated and the extra liquid circulates without doing scrubbing work.
Ratios above 10 gal/1,000 ft³ do not improve removal on this route, per the EPA cost-manual wet-scrubber chapter, §6 Ch.2, which sets a ceiling on useful liquid flow. Liquid beyond that point adds pump power, adds water demand, and adds blowdown volume without buying capture, so L/G is chosen against the target particle size instead of being pushed as high as the pump allows.
Pressure Drop and the Fine-Particle Target
Pressure drop is the wet route’s efficiency currency, and the required amount is set by the size band the limit targets. Control of PM10 is generally achieved at a gas-side pressure drop under 20 in. w.c., while control of PM2.5 generally requires 25 in. w.c. or more, per §6 Ch.2. A high-energy venturi configuration runs at roughly 30 in. w.c. or more, which puts it at the top of the energy range for particulate work.
That step change is where wet collection pays its energy penalty. Fabric filtration holds its removal rates at a typical system pressure drop of 5 to 20 in. w.c., so a PM2.5 duty asks the wet route to run at a pressure drop the baghouse does not need. Fan power scales with pressure drop and gas volume, which makes the penalty visible on the electricity bill, not only in the specification.
Adding pressure drop stops paying above about 45 in. w.c., where the removal benefit is no longer significant. A design that pushes beyond that point spends fan energy without buying compliance, and the size band the site has to meet, not the pressure drop a vendor can offer, is what determines whether the target is reachable.
Mist Elimination: The Part That Decides Carryover
The mist eliminator is the wet scrubber’s last capture stage and its most easily overlooked design input. That stage drops about 0.5 to 1.0 in. w.c. on this equipment class, and it requires periodic washing to keep that pressure drop and its drainage path open. A specification that lists L/G and scrubber pressure drop but omits the eliminator leaves the carryover risk unpriced.
Droplets that pass the eliminator are re-entrained beyond the sampling plane, and they carry dissolved solids out of the vessel with them. A removal figure measured at the outlet therefore depends on eliminator condition at the time of the test, which is the same measurement-basis problem that makes two headline percentages incomparable. Confirm the eliminator’s pressure drop and its washing provision before you accept an outlet guarantee.
Decision point: you can now write a wet-scrubber design input list covering L/G, the gas-side pressure drop matched to your target size band, and the mist eliminator’s pressure drop and washing provision, and you can see where the wet route’s fan energy and water demand are committed.
The Water and Waste Ledger That Decides Feasibility
A wet scrubber either closes its water and waste balance on your site or it does not, and that question is answered before efficiency is. Liquid leaves the circuit continuously and has to be replaced; solids arrive with the gas and have to leave as a stream somebody accepts. Both sides of that ledger are project inputs you can collect now, and either of them can override a route that looks better on paper.
Water In: Makeup, Evaporation and Entrainment
Makeup water is what the project has to supply to keep the circuit running, and it is set by a balance, not by a catalogue figure. Liquid leaves a recirculating scrubber through three paths: it evaporates into the gas stream, it leaves as droplets entrained past the mist eliminator, and it is bled deliberately to control solids. Whatever leaves through those paths has to be replaced, so makeup is the sum of evaporation, entrainment, and bleed.
The makeup volume comes from a recirculation-system calculation, not from a fixed figure, which is why two duties with the same gas volume can need different water supply (§6 Ch.2). The evaporation component rises with inlet gas temperature and with the moisture the gas already carries, because hot dry gas absorbs more liquid before it saturates. Site water availability and the cost of treating the resulting stream belong in the project brief before the route is chosen.
Water and Solids Out: Bleed and Sludge
Bleed is the deliberate withdrawal that keeps dissolved and suspended solids from building up in the recirculating liquid, and its size follows from the solids concentration you are willing to carry (§6 Ch.2). A portion of the recirculating liquid is bled to hold the solids concentration at 20 to 30 percent by weight, and venturi scrubbers typically run at peak solids concentrations in that same 20 to 30 percent band.
The bleed stream is either reused elsewhere in the plant or discharged, and the remaining solid or sludge goes to landfill when it is non-toxic and inert. Where the gas carries hazardous particulate, the sludge requires treatment or hazardous-waste disposal instead, which turns a waste-handling task into a permitted activity. Bleed rate and sludge production follow from the solids the gas delivers divided by the concentration you permit, so a heavier dust load produces proportionally more sludge.
Size the handling and disposal path at design load, not at the average. A path sized on average dust loading runs out of capacity or permit headroom during the peaks that the collector was bought for, and the fix is expensive once the civil work is in.
Is the Sludge a Hazardous Waste?
The determination is a procedure, not an inference from the dust’s name. Solid waste is hazardous when it is listed as such or when it exhibits any one of four characteristics: ignitability, corrosivity, reactivity, or toxicity. The rule set comes from the EPA hazardous-waste identification page, and it applies to the stream you produce, not to the process behind it.
Two of the four characteristics carry the thresholds that matter for a scrubber. Corrosivity applies to an aqueous solution with a pH less than or equal to 2, or greater than or equal to 12.5, and reactivity covers materials that react with water, which is the characteristic a wet collector is most exposed to because its own liquid is the reactant. Toxicity is determined by the leaching procedure, not by total metal content.
A metal-bearing scrubber sludge is where corrosivity or reactivity is most likely to be triggered, and that likelihood is an engineering judgement, not a laboratory result. The deliverable is a laboratory determination on the bleed or sludge stream you produce, run before the disposal route is fixed, plus a receiving facility that has confirmed in writing what it will accept. This page does not pre-judge the outcome for any duty.
Decision point: you can now close a water balance for the wet route, size bleed and sludge handling against design dust load, and specify the laboratory determination and confirmed disposal route that the sludge question demands before construction starts.
How Each Route Fails
Failure on either route announces itself through operating signals long before it becomes a breakdown, and those signals are cheap to watch. This module sets out what fails on each collector, which reading moves first, and what the response asks of the plant.
Baghouse Failure Modes
Blinding is the first failure mode, and it shows up as lost permeability. Dust works into the depth of the cloth until the cake stops releasing, so each cleaning cycle restores less of the original pressure drop. The signal is a pressure drop that ratchets upward while cleaning runs more often, and the response is bag replacement, not more cleaning effort.
Fabric failure is the second mode, and it lets dust pass untreated. Abrasion at the inlet, a thermal excursion beyond the medium’s limit, or chemical attack opens holes and tears, while the collector keeps running and penetration rises. Watch for a stack plume or a rising outlet reading at an unchanged pressure drop, and plan on bag replacement plus a check of the cause.
Uneven flow is the third mode, and it is the easiest to miss. Channeling or a compartment imbalance leaves one region of cloth overloaded while another does little work, so bags fail in patches while the overall reading still looks acceptable. The signals are cleaning cycles firing at different frequencies between compartments and localized bag failures, and the response is flow balancing or inlet pre-treatment.
Wet Scrubber Failure Modes
Scaling is the wet route’s first failure mode, and it builds where the liquid chemistry is out of balance. Dissolved solids precipitate on internals and packing when concentration, temperature, or pH drifts outside the range the design assumed, and the deposit narrows the gas path. The signal is a pressure drop that climbs with the liquid flow unchanged, and the response is chemistry control plus a cleaning provision the design has to include.
Nozzle plugging is the second mode, and it removes the contact the scrubber depends on. Solids in the recirculating liquid, or precipitation inside the header, block an orifice and cut spray coverage in one zone, lowering capture without changing the pressure drop much. The signal is a spray-header pressure that rises against a fixed pump setting, and the response is strainer and nozzle maintenance the plant can hold to.
Eliminator fouling and corrosion round out the list, and both surface downstream of the collector. A fouled eliminator passes droplets that carry dissolved solids past the sampling plane, so the stack looks wet while the outlet reading claims compliance. Corrosion follows where the material and the wet chemistry do not match, and the response is a material review with inspections set by the rate the plant observes.
Decision point: you can now name the failure each route is prone to, you can pick the operating signal that reveals it first, and you can tell which faults call for replacement, which call for chemistry or flow correction, and which call for a material review.
What Drives Cost on Each Route
Cost on either route is a structure, not a single number, and the structure is what a comparison has to align. The two collectors are priced from different quantity take-offs, so a bid comparison only means something once both scopes cover the same equipment. This module lists what sits inside each one.
Capital Cost Drivers
A baghouse is priced largely by how much cloth and steel the duty needs. Air-to-cloth ratio fixes the cloth area, so a lower ratio buys more fabric, a larger housing, and more compartments taken off-line for cleaning at any moment. Cleaning hardware, its compressed-air supply, and any fabric upgrade the dust or gas forces sit inside the same scope, so the ratio chosen early sets the capital direction.
A wet scrubber is priced by the pressure drop its target size band demands. Tower size and internals follow from that pressure drop, and the recirculation pump, piping, mist eliminator, water connection, and blowdown and sludge handling equipment follow from the liquid flow it needs. The scope therefore grows with the fine-particle target, not with gas volume alone.
The two routes are not priced by a common unit, so a like-for-like comparison has to normalise what sits inside the battery limits. Scope comes before price in that exercise: a bid that excludes the sludge handling, the water connection, or the compressed-air package is not a cheaper version of the same collector.
Operating Cost Drivers
A baghouse carries its recurring cost in fan energy and cloth. System pressure drop sets the fan power, replacement bags recur as the cloth ages, the cleaning system consumes compressed air, and the collected dust leaves as a dry solid that still has to be handled. A higher air-to-cloth ratio trades cloth area against fan energy and bag life, which is where the recurring balance sits.
A wet scrubber carries its recurring cost in fan energy, pump energy, water, and waste. The pressure drop the size band requires sets the fan power, the recirculating flow sets the pump power, and makeup water replaces what evaporates and leaves as droplets. Bleed and sludge disposal close the list, and a sludge with hazardous characteristics carries its own handling requirements.
Where the dust load is heavy and the solids leave as sludge, water and waste dominate the wet route’s recurring cost; where the duty is dry and the gas is benign, energy and cloth dominate the baghouse’s. The crossover depends on the duty, not on the equipment class, which is why both ledgers have to be built from the same gas and dust data.
Decision point: you can now list what each route’s capital and operating scopes contain, you can normalise two bids to the same battery limits before comparing them, and you can see which cost line your own dust load will push hardest.
The Six-Input Matrix and the Decision
Six inputs decide this comparison, and they are applied in a fixed order because each one can remove an option before the next is tested. The matrix below compresses that logic, and the closing judgement states which route owns which duty.
The Six Inputs and What Each One Tests
Particle size distribution comes first because it sets the size band the limit targets, and that band decides the pressure drop the wet route must run at. Stickiness and hygroscopicity come second, because they decide whether the dust blinds fabric and can remove the baghouse option on its own.
Temperature comes third and tests two limits at once: whether the gas sits inside a fabric ceiling and whether it stays above the dew point in every operating mode. Combustible and reactive character comes fourth, adding an explosion-protection obligation to either route and, for reactive metals, a water reaction the wet route has to manage.
Water availability comes fifth, because a wet route needs makeup supply and a site that tolerates the resulting streams. Waste route comes sixth and asks where the collected material goes: a dry solid from a hopper, or a bleed and sludge stream that may need hazardous-waste handling.
Apply the list in order and note which input eliminates and which one only ranks. The first three can remove the baghouse outright, the fourth imposes obligations on both, and the last two decide whether the wet route is feasible on your site.
The Matrix
The matrix translates each input into a route preference, and where a module left the answer conditional, the cell names what it depends on.
| Input | Points to the baghouse when… | Points to the wet scrubber when… |
|---|---|---|
| Particle size distribution | The limit targets a coarse band that fabric filtration reaches without extra energy | The limit targets fine particles and the plant will carry the pressure drop that band requires |
| Stickiness and hygroscopicity | The dust is dry and free-flowing, so the cake releases during cleaning | The dust is sticky, hygroscopic, oily, or condensable and would blind fabric |
| Temperature | The gas sits inside the selected fabric’s ceiling and stays above the acid dew point in every mode | The gas exceeds any fabric ceiling, or the dew-point margin cannot be held |
| Combustible and reactive character | Depends on the protection concept the authority having jurisdiction accepts | Depends on the same protection concept, plus the water reaction of reactive metals |
| Water availability | No makeup supply is needed, which suits sites without a water or discharge route | Makeup supply and a discharge or reuse route are both available |
| Waste route | Collected dust leaves as a dry solid that can be reused or handled conventionally | Bleed and sludge handling is available, with hazardous-waste testing on the stream |
Two cells carry a dependency instead of a preference, and both are honest limits of this page. Read by row and stop at the first row that produces a clear preference, because a later row cannot rescue an option an earlier one removed.
When Neither Route Fits
Some duties have no clean answer, and naming them is part of the comparison. Dust that needs pre-separation before either collector, and a gas stream that needs cooling or dilution first, both point to work that sits ahead of the selection itself.
Two further cases sit outside this page’s reach. Where the load or the duty cycle swings enough that the design case has to be fixed first, the route question waits until that case is agreed; where both routes are feasible, the deciding factor may be project scope, plot space, or an existing permit condition.
Recommending pre-treatment ahead of the collector is a legitimate outcome of this comparison, not a failure to answer it. A cyclone ahead of a fabric filter or a quench ahead of a wet scrubber changes the duty enough that the route question becomes simple.
The Decision
On some duties the baghouse is the correct answer, and this page says so. A dry, free-flowing, non-combustible dust at a temperature inside the fabric ceiling, with no water supply and no discharge route for a bleed stream, is a baghouse duty: the wet route has no water to work with and the dry route has no obstacle in front of it. The constraint there is the dust and the site, not the equipment this site builds.
Where the dust is sticky or hygroscopic, where the gas runs above any fabric ceiling, where the dew-point margin cannot be held, or where the plant can supply water and manage a sludge stream, the wet route carries the duty. Those are condition matches, not a ranking, and the route is chosen by what the dust and the gas allow.
Act on the matrix, not on a specification sheet. Gather the six inputs for your own duty, apply them in order, and let the first eliminating row decide the route; then hand the design inputs to whoever will quote it, the air-to-cloth ratio on one side and the L/G, pressure drop and waste route on the other. That is the only form of the baghouse vs wet scrubber efficiency comparison that survives contact with a real gas stream, and it tells you when the answer is the collector you did not expect.
Worked Example: Walking the Six Gates
The chain is easier to trust once it has been run end to end on numbers. The duty below is a case chosen to exercise every gate, and its inputs are round illustrations, not measurements. Change any one of them and the chain is re-run from the top.
The Duty
The case is a mineral dust from a drying operation. The exhaust flow is 12,000 acfm at 350 °F, the dust load entering the collector is 40 lb/h, and roughly half that mass sits below 10 µm, the band the site’s limit targets.
The remaining inputs are qualitative. The dust is hygroscopic and carries a light oil film, the material is not combustible and does not react with water, and the plant has process water and a permitted discharge but no confirmed landfill route.
Walking the Six Gates
Particle size comes first, and it sets the pressure drop the wet route would have to run at without excluding anything by itself.
Stickiness removes the baghouse. A hygroscopic dust carrying an oil film forms a deposit that does not release from the cloth during cleaning, so the dry route is out before temperature is considered.
Temperature and combustibility confirm the direction without changing it. The gas at 350 °F carries moisture and a condensing acid component, so the dew-point margin cannot be guaranteed in every mode, and the dust is neither combustible nor reactive, so no explosion-protection obligation is added to the wet design.
Water availability passes, because the plant can supply makeup and holds a permitted discharge. The waste route stays conditional, because the sludge has to be characterized before a receiving facility confirms what it will take. One route survives with an outstanding action: the wet scrubber, conditional on the sludge determination.
Sizing the Route That Survives
Sizing starts from the target band. Control of PM2.5 generally requires a gas-side pressure drop of 25 in. w.c. or more, per the wet-scrubber design inputs set out above, so the design point is 25 in. w.c. That design point is an engineering inference drawn from the cited pressure-drop requirement and the stated target band, not a quoted value.
The solids side follows from the same duty data. With a dust load of 40 lb/h and a permitted solids concentration of 25 percent by weight, the mid-point of the 20 to 30 percent band set out in the water and waste ledger above, the wet sludge rate is 40 ÷ 0.25, which is 160 lb/h. That figure is an engineering inference computed from the cited band and the stated dust load, not a measured or guaranteed value.
Three assumptions carry the arithmetic: all captured dust reports to the bleed stream, the solids concentration holds at the target, and the load stays at the stated rate. Change any input, raise the load or lower the permitted concentration, and the sludge rate moves in proportion, so the chain is re-run.
Had the dust been dry and non-hygroscopic, the same chain would have returned a baghouse, and the sizing would have been the cloth-area division from the air-to-cloth table above: gas flow divided by the tabulated ratio for that dust gives the net cloth area, with gross area larger because compartments come off-line for cleaning.
Acceptance and Pilot Scope
Acceptance starts by checking the specified design values against what was built. The L/G and design pressure drop named in the specification should match the as-built equipment, and the operating pressure drop at design flow is the first field value to record.
Performance is then verified at the band that matters. The outlet concentration is measured against the size band the permit targets, not against a total figure the coarse fraction can flatter, and on a wet route the eliminator condition and its carryover are checked at the same time.
The water balance is verified as an operating check. Makeup, evaporation, and bleed are compared in service, which shows whether the design assumptions held, and the bleed concentration is confirmed as the value the sludge arithmetic depends on.
The sludge determination closes the loop. A laboratory result on the bleed or sludge stream, received before the disposal route is confirmed, turns the conditional gate into a closed one, and the receiving facility’s written confirmation completes it.
A pilot or site trial is justified where the dust load varies, where the dust is unfamiliar, where the size-band limit is tight, or where the water balance is not yet proven on that site. Full scale with a performance test suffices for a well-characterised dust on a steady load with a settled water and waste position.
Hold four records when the job closes: the design inputs as specified, the measured operating values at design flow, the laboratory result on the sludge, and the disposal route confirmation.
Decision point: you can now run your own duty through the six inputs to a single route, size it with the constants this page cites, and write an acceptance list that names what is measured, who confirms it, and what stays on file.
Where to Go Next
Several adjacent decisions belong to other pages, and keeping them separate is what holds this comparison focused on route choice. Each destination below owns a decision this article deliberately does not make, and the boundary is stated with the hand-off.
Adjacent Decisions Belong to Other Pages
Where a gas stream carries acid gases as well as particulate, the dry-versus-wet route question and its total cost of ownership sit with the dry scrubber versus wet scrubber selection and cost comparison.
Adsorption is a different capture mechanism from either route on this page, and the carbon filter versus wet scrubber comparison covers when that route displaces wet particulate capture.
Material selection and how it behaves across a ten-year operating life are set out in the wet scrubber versus traditional scrubbers cost savings breakdown, which this page does not attempt to price.
Permit limits appear here only as design inputs, and the standards themselves with the compliance procedure are covered in the wet collectors and scrubbers industrial compliance guide.
Routing a process stream to a treatment technology in the first place is a cross-technology question, and the industrial process exhaust treatment library holds that routing matrix.
What wet collection is and how a collector’s internals perform the capture are covered in how a wet dust collector works, which sits one level below the design inputs set out here.
Choosing between wet collector configurations, not between routes, is the decision the wet scrubber configuration selection guide owns.
Each of those pages carries its own evidence and its own decision, and none of them re-opens the route question answered above.
Specifying Your Own Duty
A quote becomes comparable only when the scope is defined the same way on both sides, which is the point about normalising battery limits made earlier. For a wet route, the equipment that does the work is the industrial wet dust collector, and the specification conversation starts from your dust and gas data.
Send the six inputs from the decision matrix with the inquiry: the particle size distribution set against the band you have to meet, the stickiness or hygroscopic character of the dust, the temperature and the dew-point margin, the combustible and reactive character, the water supply and discharge position, and the intended waste route.
Add the exhaust flow and the operating hours, and state whether the load is steady or swings. Those two items size the equipment and the operating pattern, and without them two suppliers can quote equipment that is not comparable.
Send the six inputs, the flow, and the hours, and you can now decide between the routes on the same basis this baghouse vs wet scrubber efficiency comparison sets out, with a design you can check line by line.
Frequently Asked Questions
Can a plant need both a baghouse and a wet scrubber?
Yes, and the two routes do not compete for one slot on a site. A plant can run a dry collector on a stream whose dust is dry and free-flowing while running a wet collector on a stream that carries a hygroscopic dust or a hot gas, and a single site often does. Where several streams share one stack, a pre-separation step ahead of either collector is what makes the pairing work.
Does a baghouse remove gases as well as a wet scrubber?
No, and not by the same mechanism: a fabric filter is a particulate device, and gas-phase capture is not what filtration performs. Where a gas also has to be captured, the treatment route changes and the baghouse is not upgraded. Choosing between dry and wet treatment for acid gases is a separate comparison with its own decision criteria, and that decision belongs to another page.
How much plot space difference should I expect between the two routes?
Expect a different footprint shape, not a simple size difference. A baghouse spreads horizontally, because its cloth area is large and compartments come off-line for cleaning, which pushes the gross area above the net area the ratio sets. A wet scrubber concentrates its working volume in a vertical vessel, and it adds a tank, a recirculation pump set, and bleed and sludge handling at grade. One route is not uniformly smaller; the space each one needs sits in a different place.
Can I avoid the sludge problem by reusing the scrubber water?
Recirculation reduces makeup demand, and it does not remove the sludge. The solids that the gas delivers stay in the circuit, where they concentrate until a portion of the liquid is bled to hold the solids at the concentration band the design permits. Reuse therefore changes the water side of the ledger, while the sludge side still has to be characterized, handled, and routed.


